


|
Navigation
Search
|
macOS Tahoe was a nightmare of freezes on my MacBook. Here’s how I finally fixed it
Thursday December 4, 2025. 12:30 PM , from Mac 911
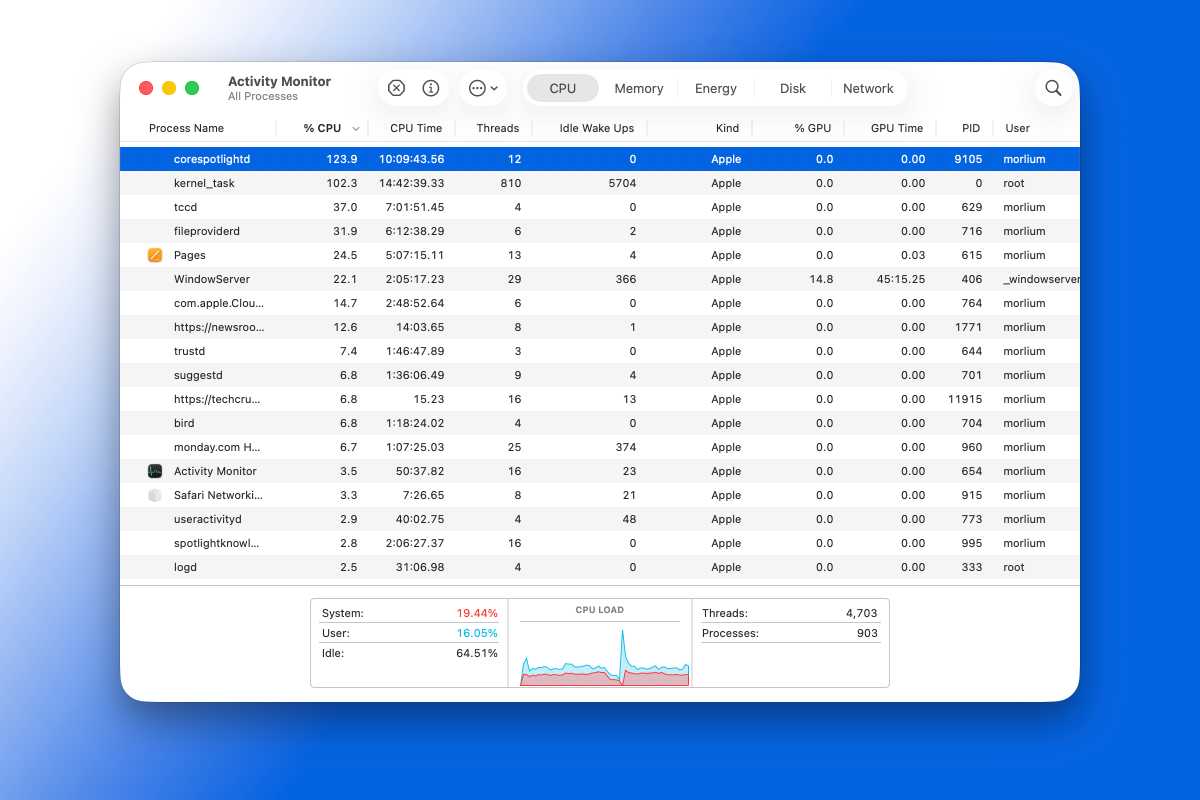
Back in September, when macOS 26 Tahoe arrived for download on my MacBook, I installed it along with millions of other people. I didn’t give it a second thought—I have an M3 Max MacBook Pro with 36GB of RAM and 1TB of storage. Running Tahoe shouldn’t be an issue. But it was. Almost immediately from the first day I installed it, I experienced intermittent freezes lasting a second or two that would interrupt whatever I was doing. I couldn’t tie it down to a single app, and it was difficult to predict. Some days it would happen numerous times each hour, but other days it wouldn’t happen much at all. I tried all the usual tricks—closing apps, restarting, shutting down—and of course I immediately updated to macOS 26.0.1, all to no avail. Since I don’t run betas on my main machine, I chalked it up to an initial release bug that would be smoothed out in 26.1. Alas, when I installed that update as soon as it arrived, the problem persisted. Back when I had an M1 MacBook Pro, I had issues with memory slowing down my machine, so I checked Activity Monitor throughout the day. Memory pressure was consistently in the green safe zone. There was one instance where my computer completely seized up due to an application memory allotment issue, but again, I couldn’t find a specific cause. I have plenty of storage, plenty of RAM, and haven’t had any issues with a specific app. Yet my machine continued to freeze randomly, some days dozens of times an hour. Shining a Spotlight on the problem So after macOS 26.1 didn’t clear up the issue, I decided to investigate further. Everything seemed okay in Activity Monitor, but I noticed an abnormality in the CPU tab. While the CPU LOAD chart didn’t appear to show any persistent issues, two processes—corespotlightd and kernel_task–were regularly using over 100 percent of the CPU. The corespotlightd process was using a ton of my available CPU percentage.Foundry I learned that each core counts as 100 percent, so technically, my MacBook could use 1,400 percent of the CPU. Still, it seemed high for a background task, so I kept an eye on it. Sure enough, corespotlightd was consistently using well over 100% of the CPU load and sometimes reaching near 200 percent. I assumed that was bad, so I went over to System Settings to check out the Spotlight tab. I don’t use Spotlight all that often, but when I did, it loaded quickly and didn’t show any obvious signs of slowing my system down. But this particular task’s name was obviously related to Spotlight, so I headed over to the Spotlight tab in the Settings app. Inside, there are a series of toggles for each of Apple’s apps, system content, and the Clipboard. But what stood out to me was the two at the top: “Show Related Content” and “Help Apple Improve Search.” In particular, the second one, which allows Apple to “store your Safari, Siri, Spotlight, Lookup, and #images search queries.” So I turned them off. And almost instantly, my CPU load dropped. I watched the corespotlightd process drop off my list of CPU percentage drainers, and the intermittent pauses stopped. I waited an hour or so, and it didn’t return, so I turned both toggles back on out of curiosity. It’s been about a week, and the issue hasn’t returned. I’m not sure if my issue was personal to my machine, but If it’s something you’re experiencing, try flipping those two toggles in the Spotlight settings. It might just return your MacBook to normal.
https://www.macworld.com/article/2999630/macos-tahoe-was-a-nightmare-of-freezes-on-my-macbook-heres-...
Related News
|

46 sources
Current Date
Dec, Wed 24 - 23:36 CET
|